Data Hub: Understand and anticipate transport market trends
Track and analyze the leading transport market indicators.
Fuel, tolls, inflation, carbon and freight indexes: access a centralized view of the data shaping the transport market.
- Shippers
- Carriers
- Consultants
Data Hub
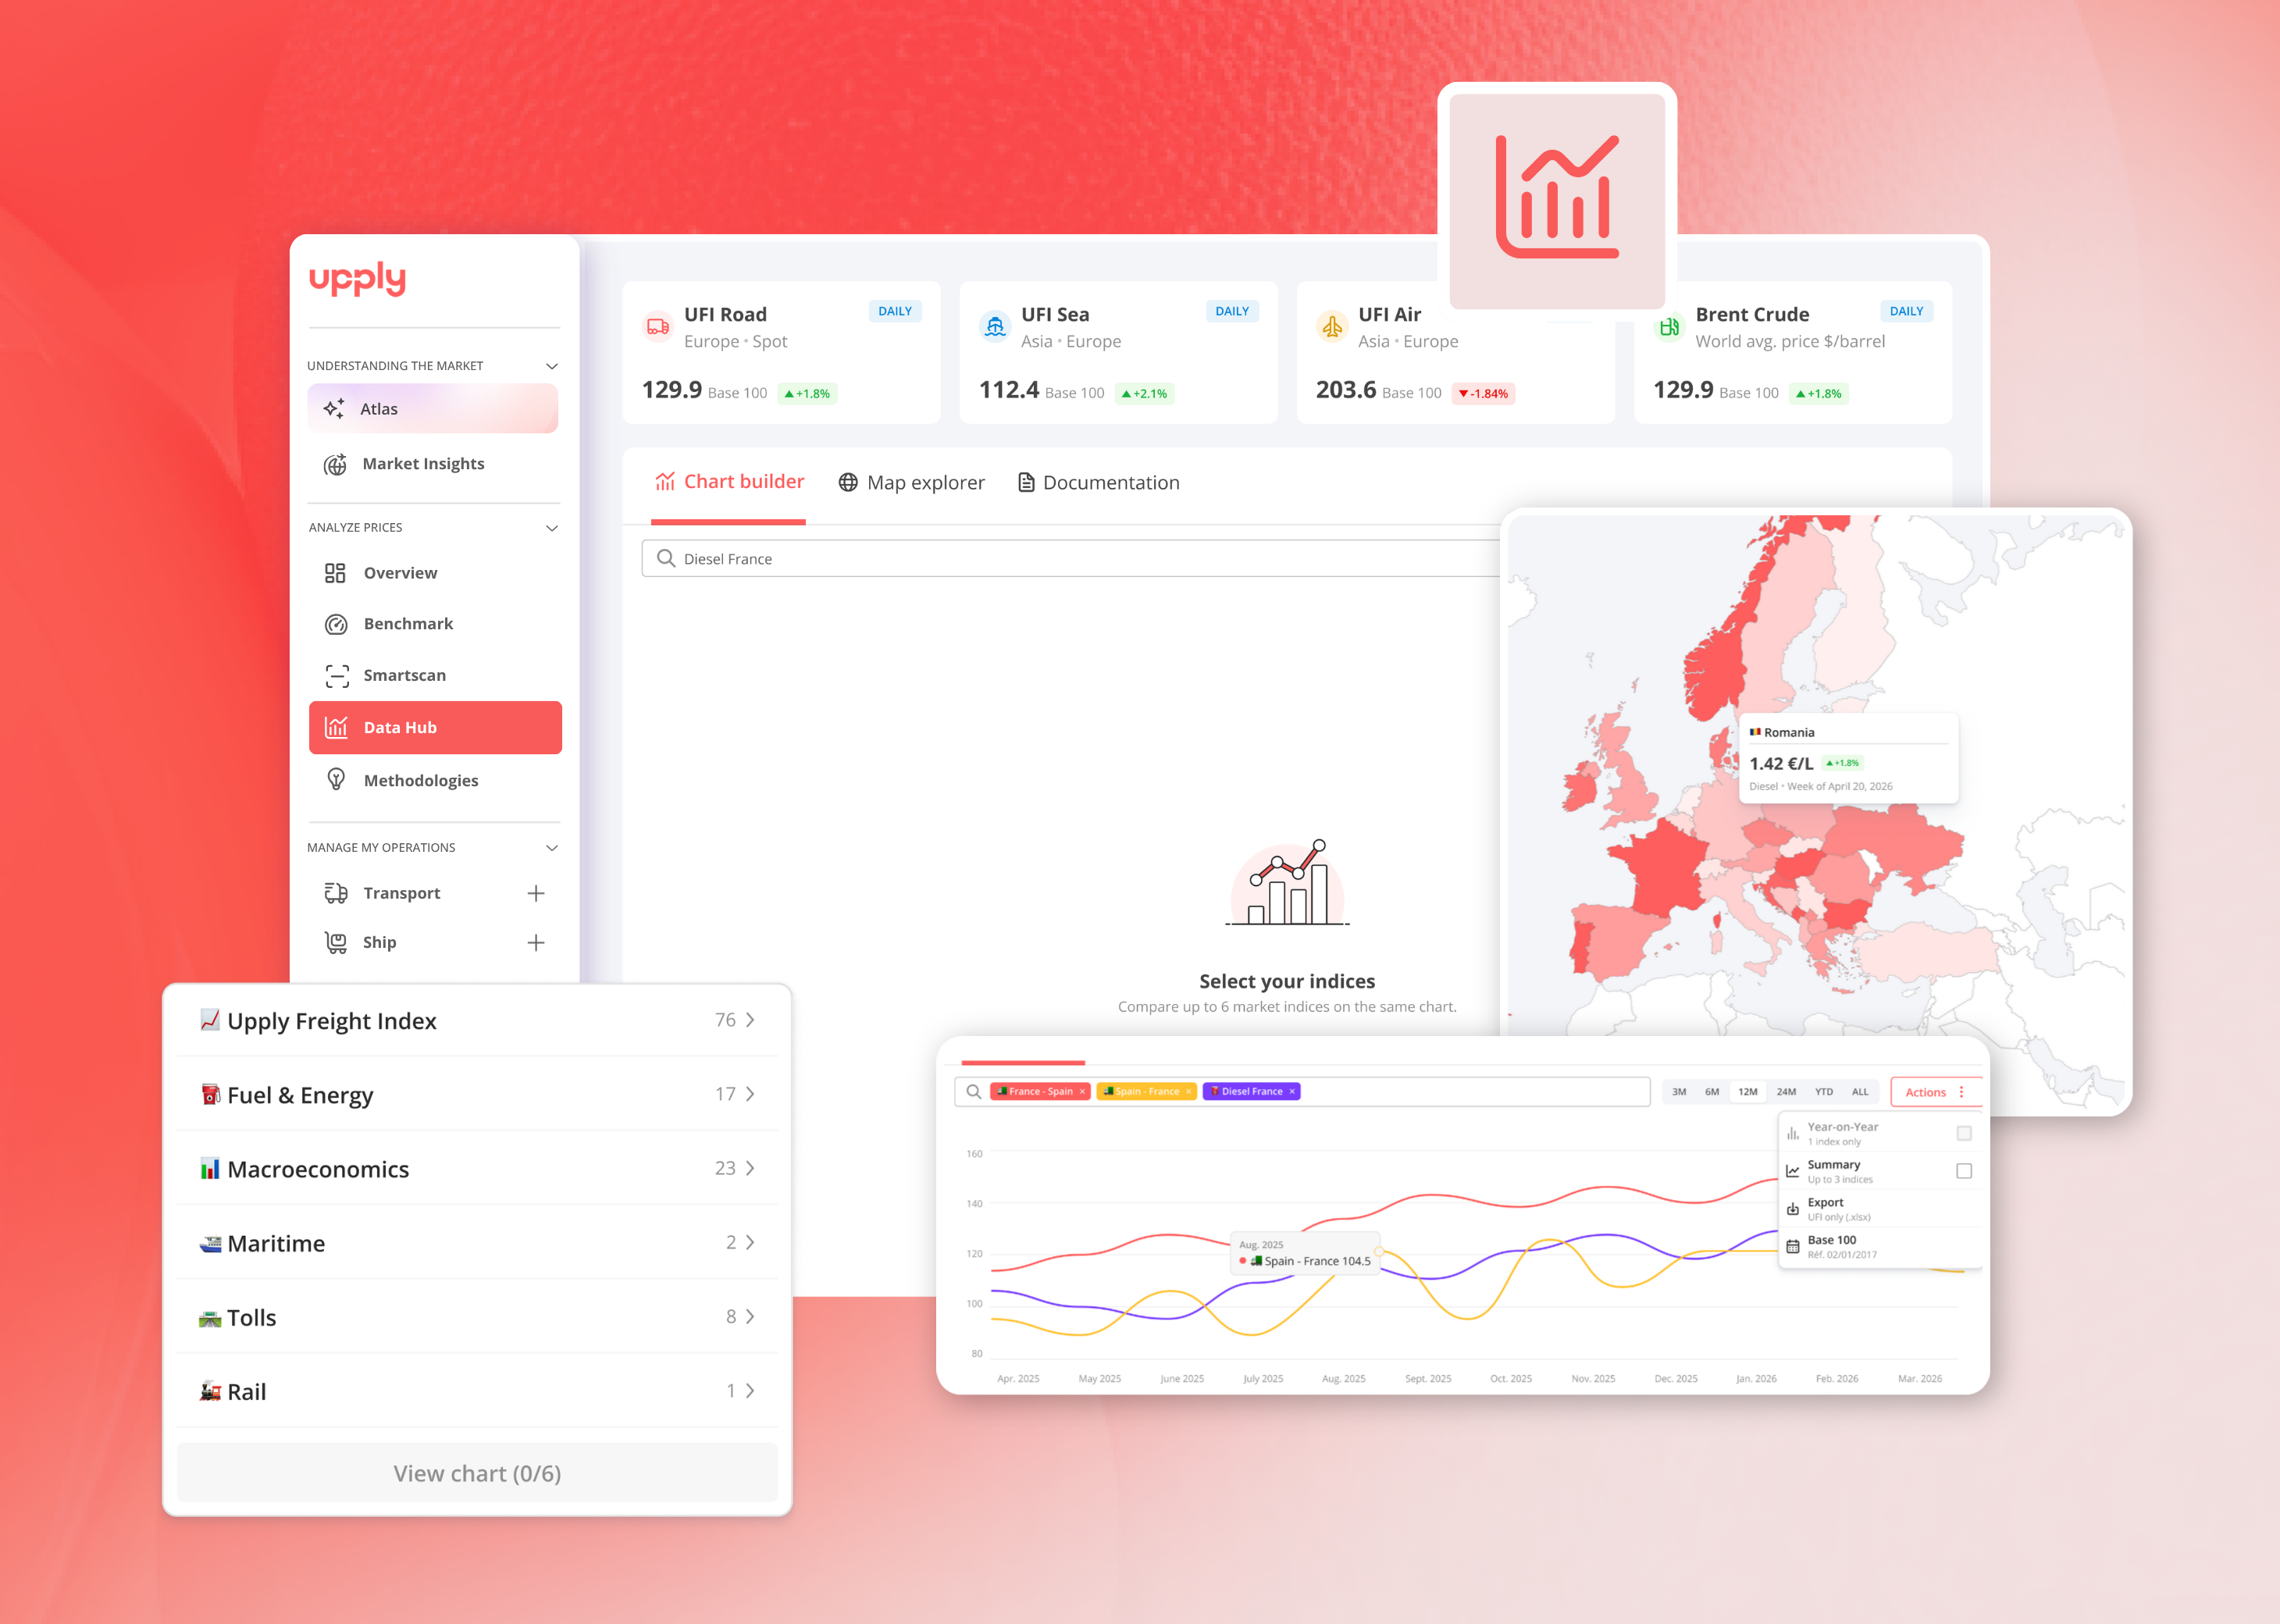
All the key market indicators in one place
Data Hub combines trusted market indicators with Upply's proprietary indexes to provide a more comprehensive view of transport market trends.
- Upply Freight Indexes (UFI): road, ocean, air and rail freight indexes
-
Fuel & Energy: diesel prices by country, maritime carbon tax, crude oil prices
-
Tolls costs by country
-
Macroeconomic indicator: inflation
-
Ocean freight: Baltic Dry Index, Shanghai Containerized Freight Index (SCFI)
-
Rail: US rail freight index and UFI Europe
Features
Explore market indicators your way
-
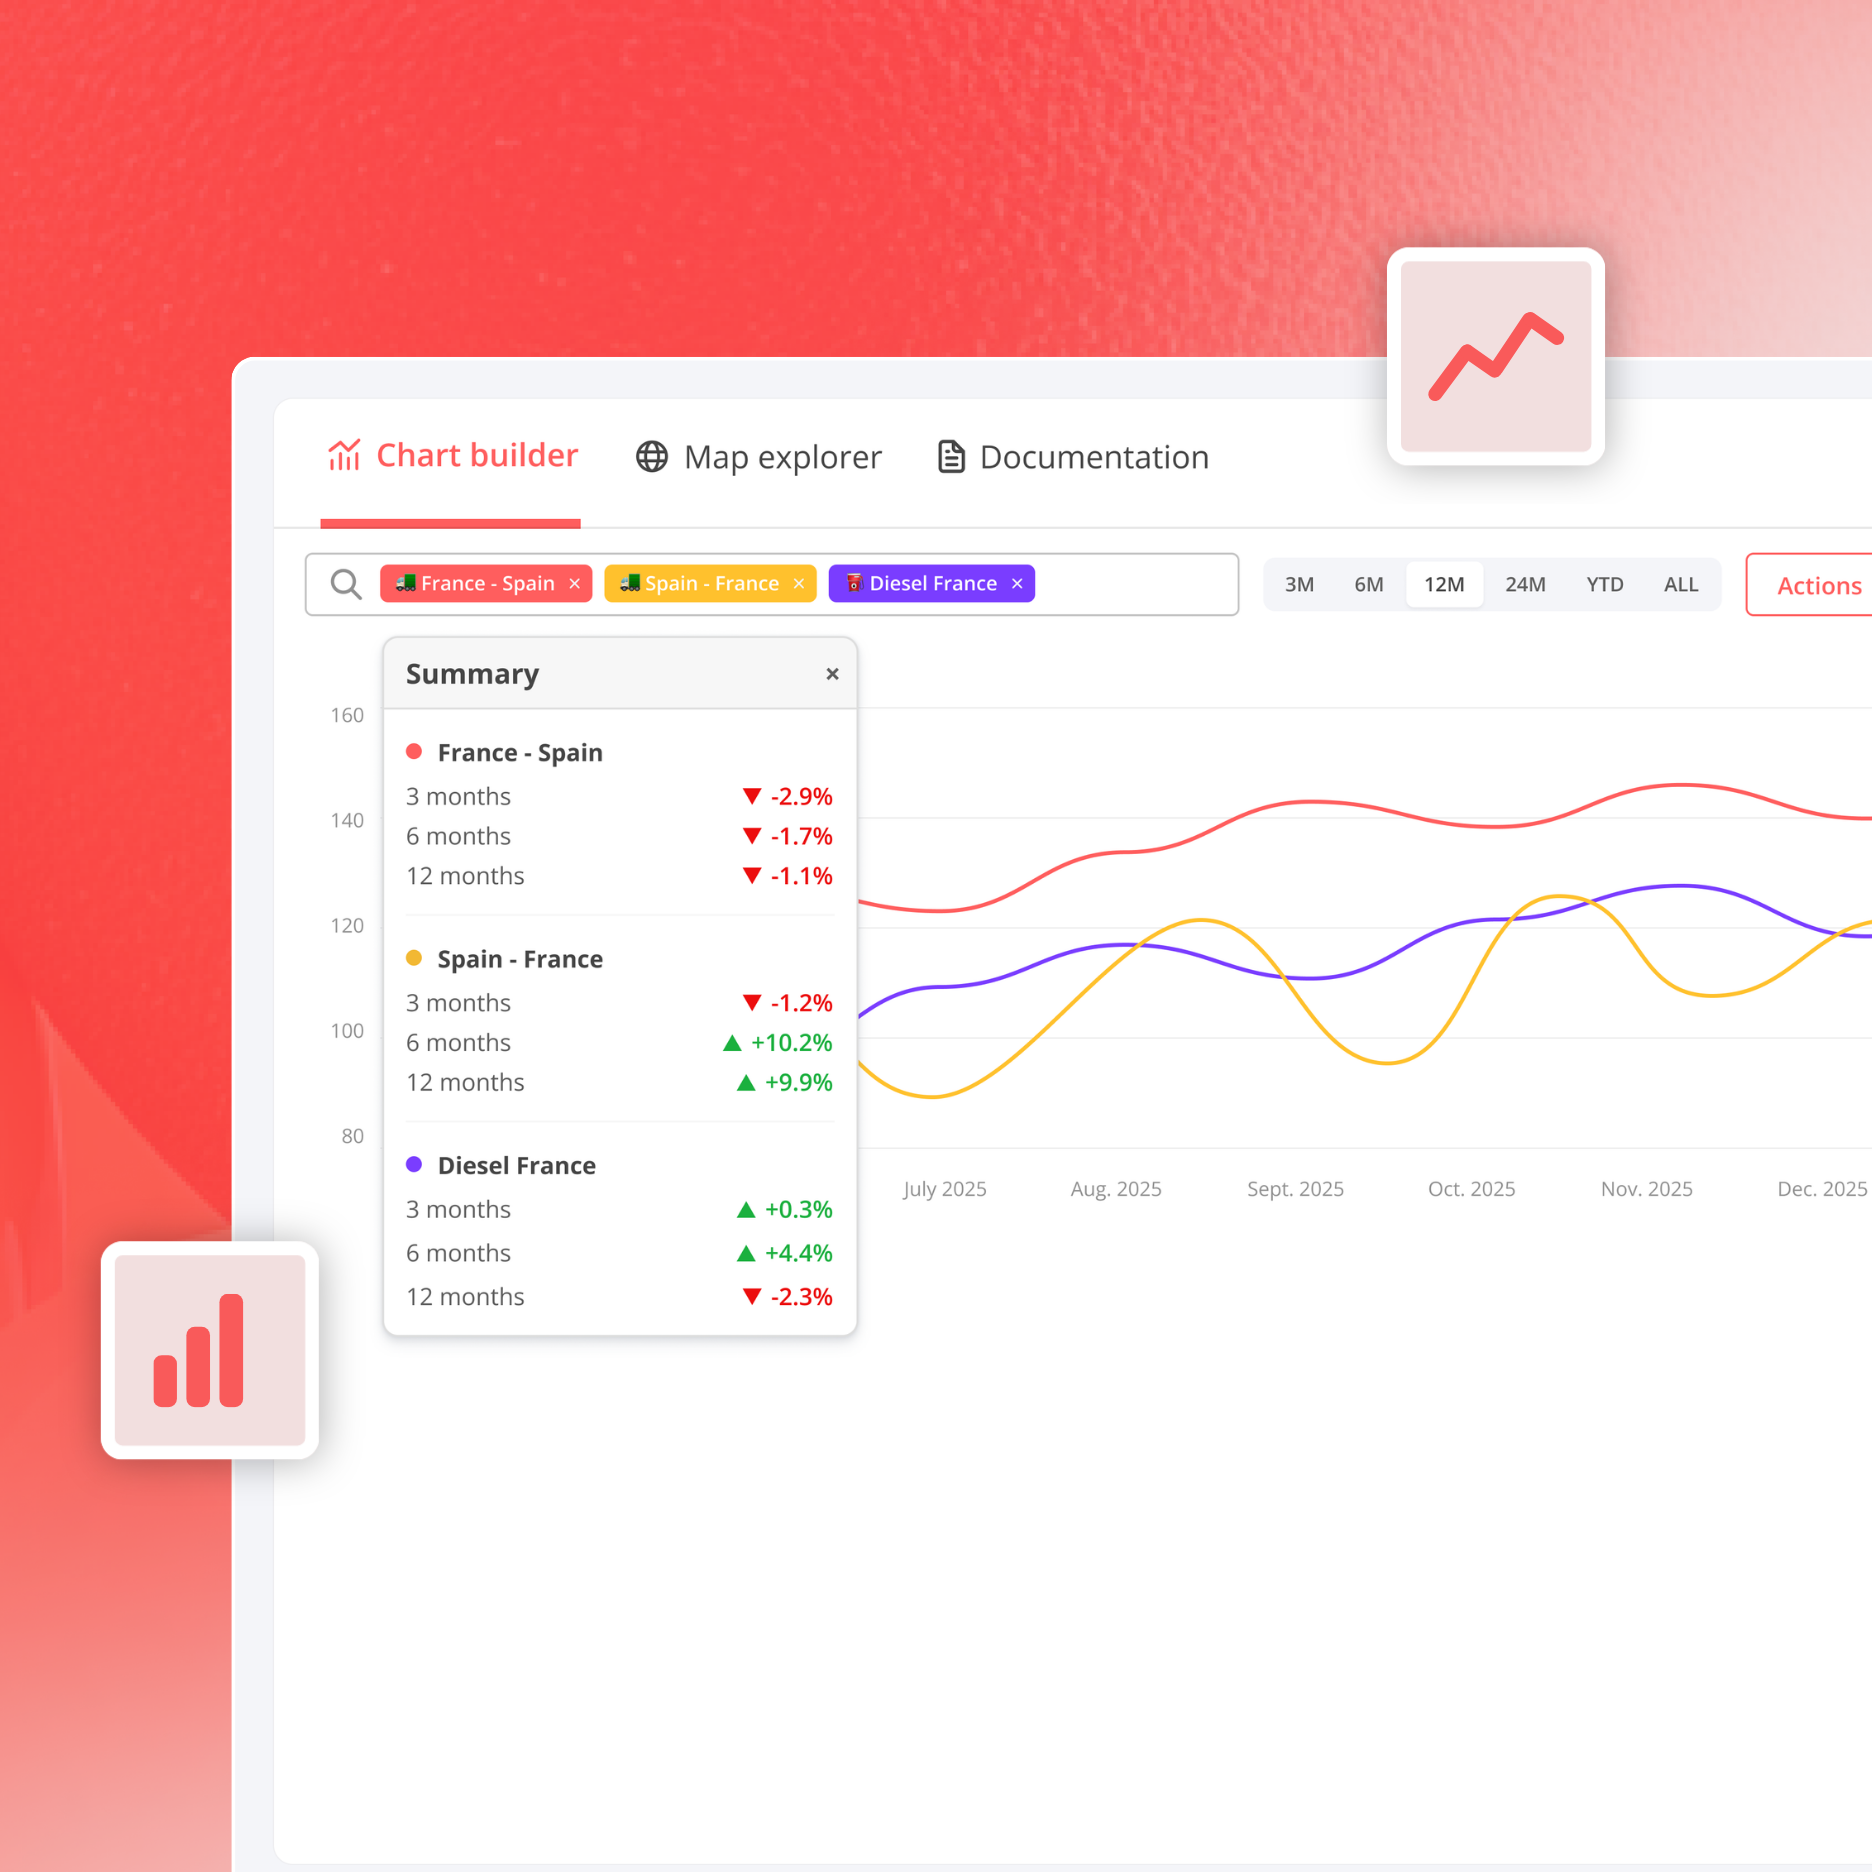
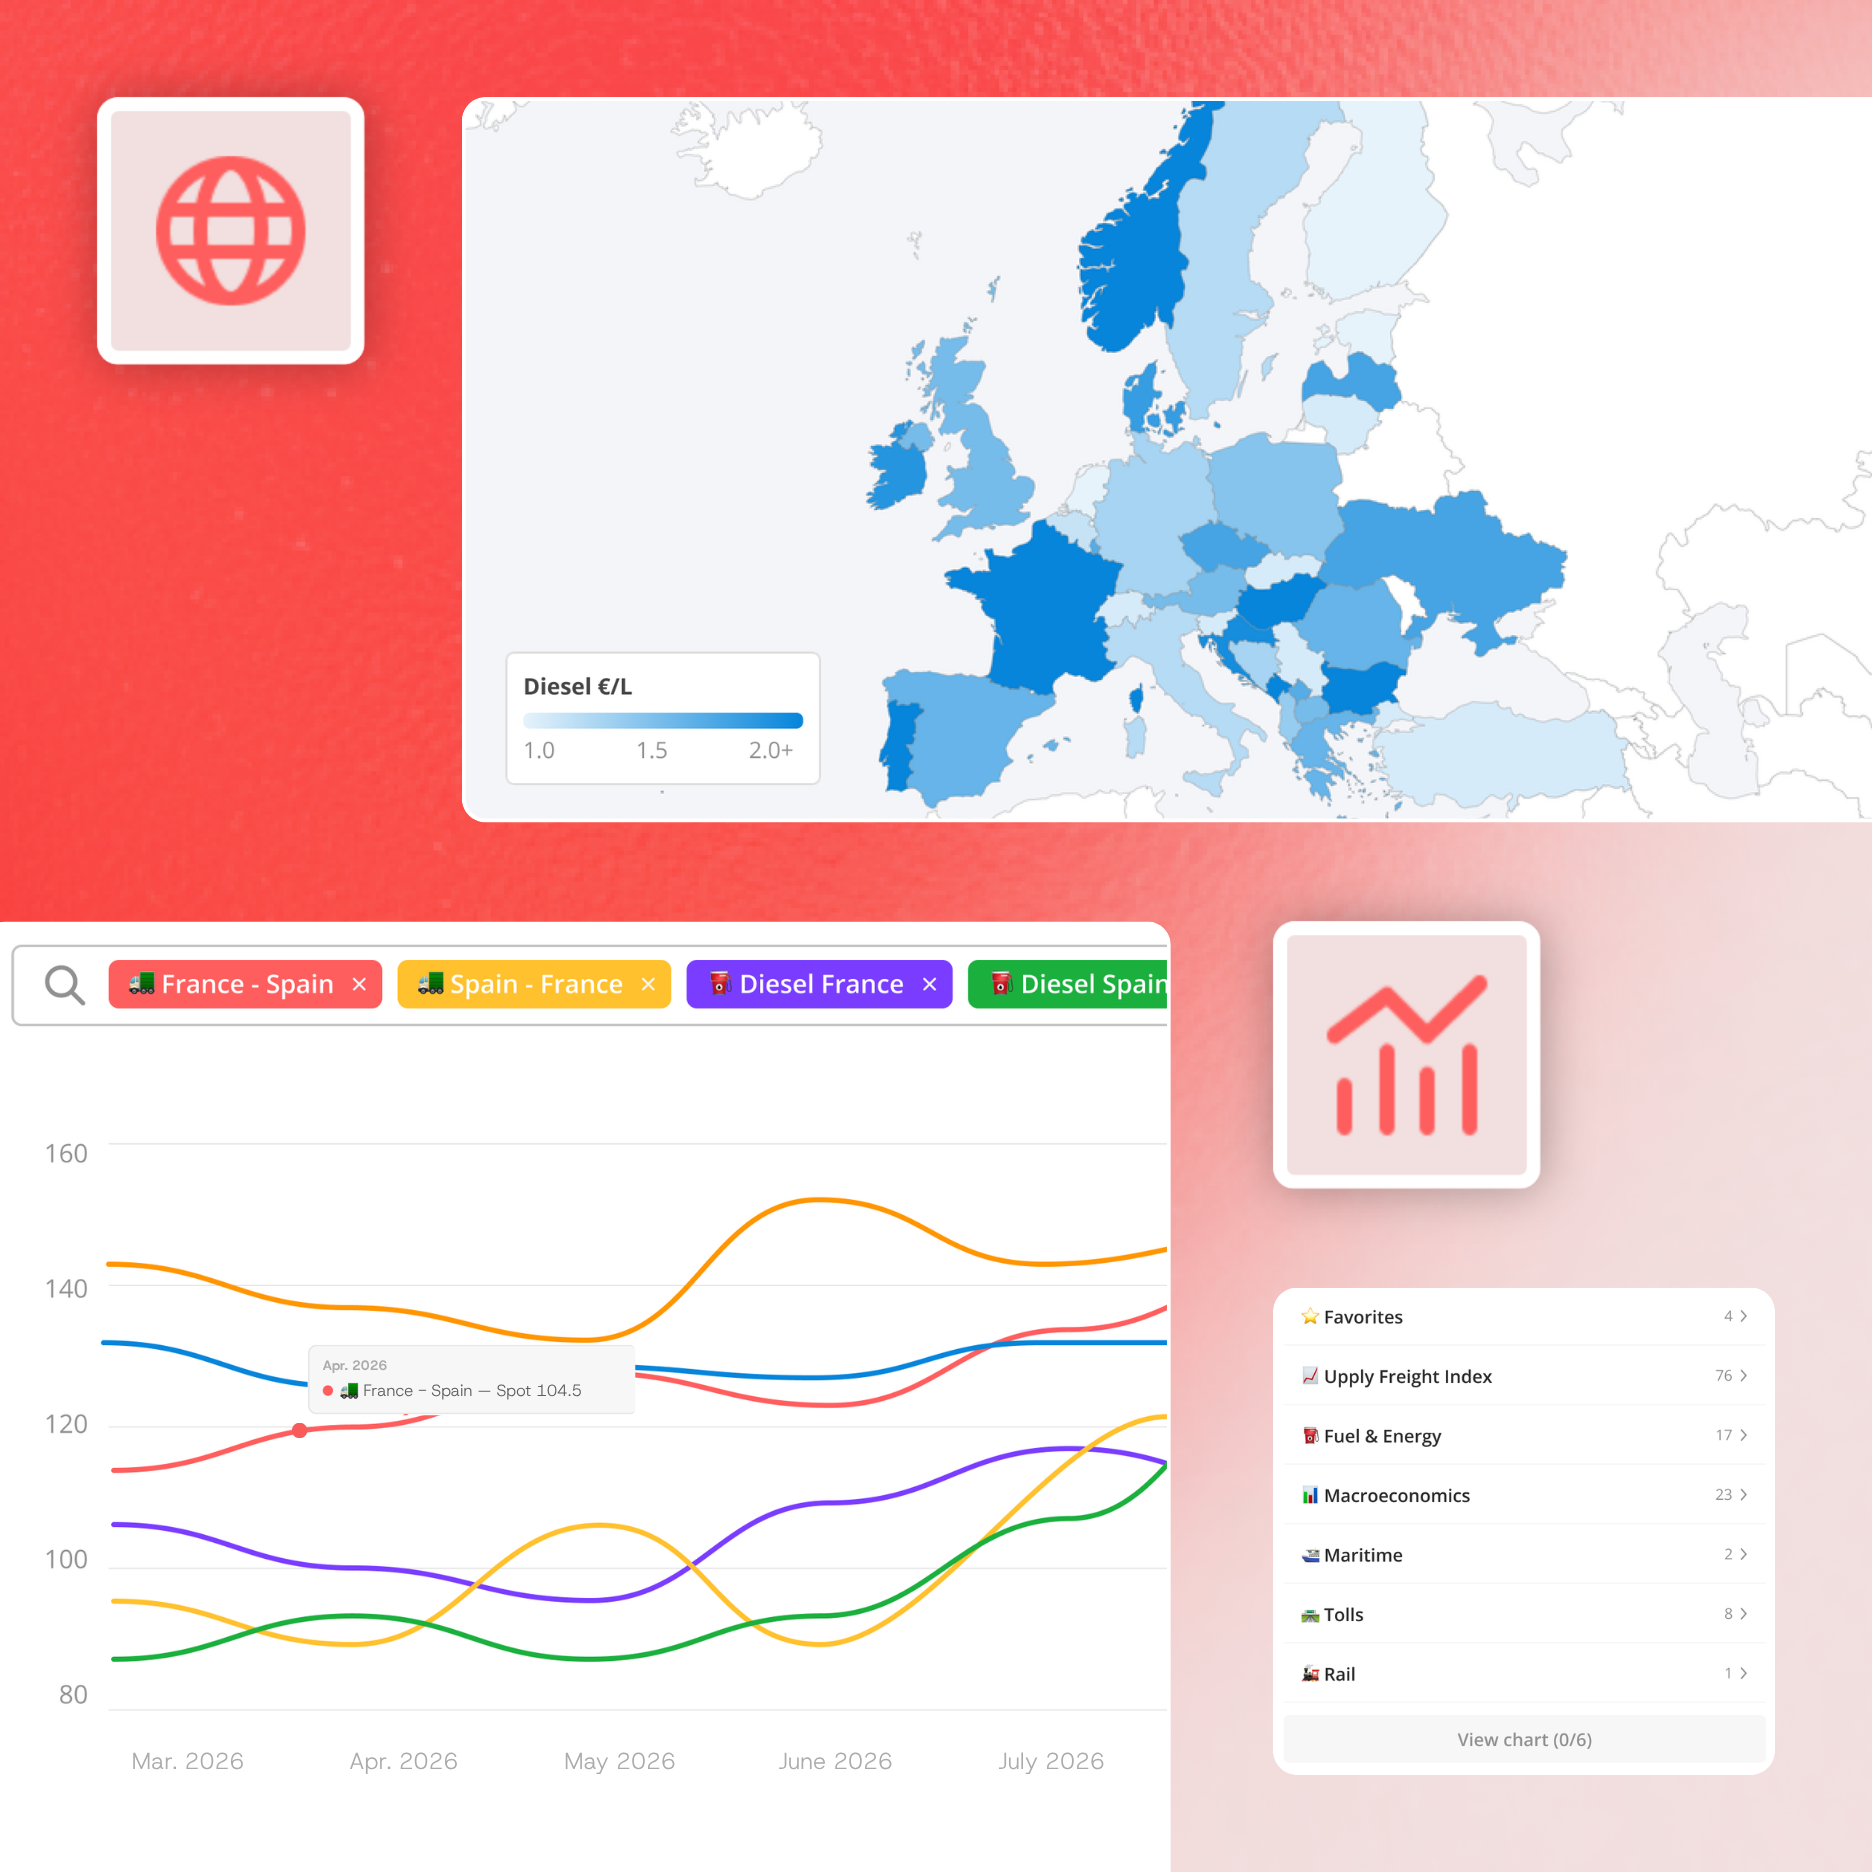
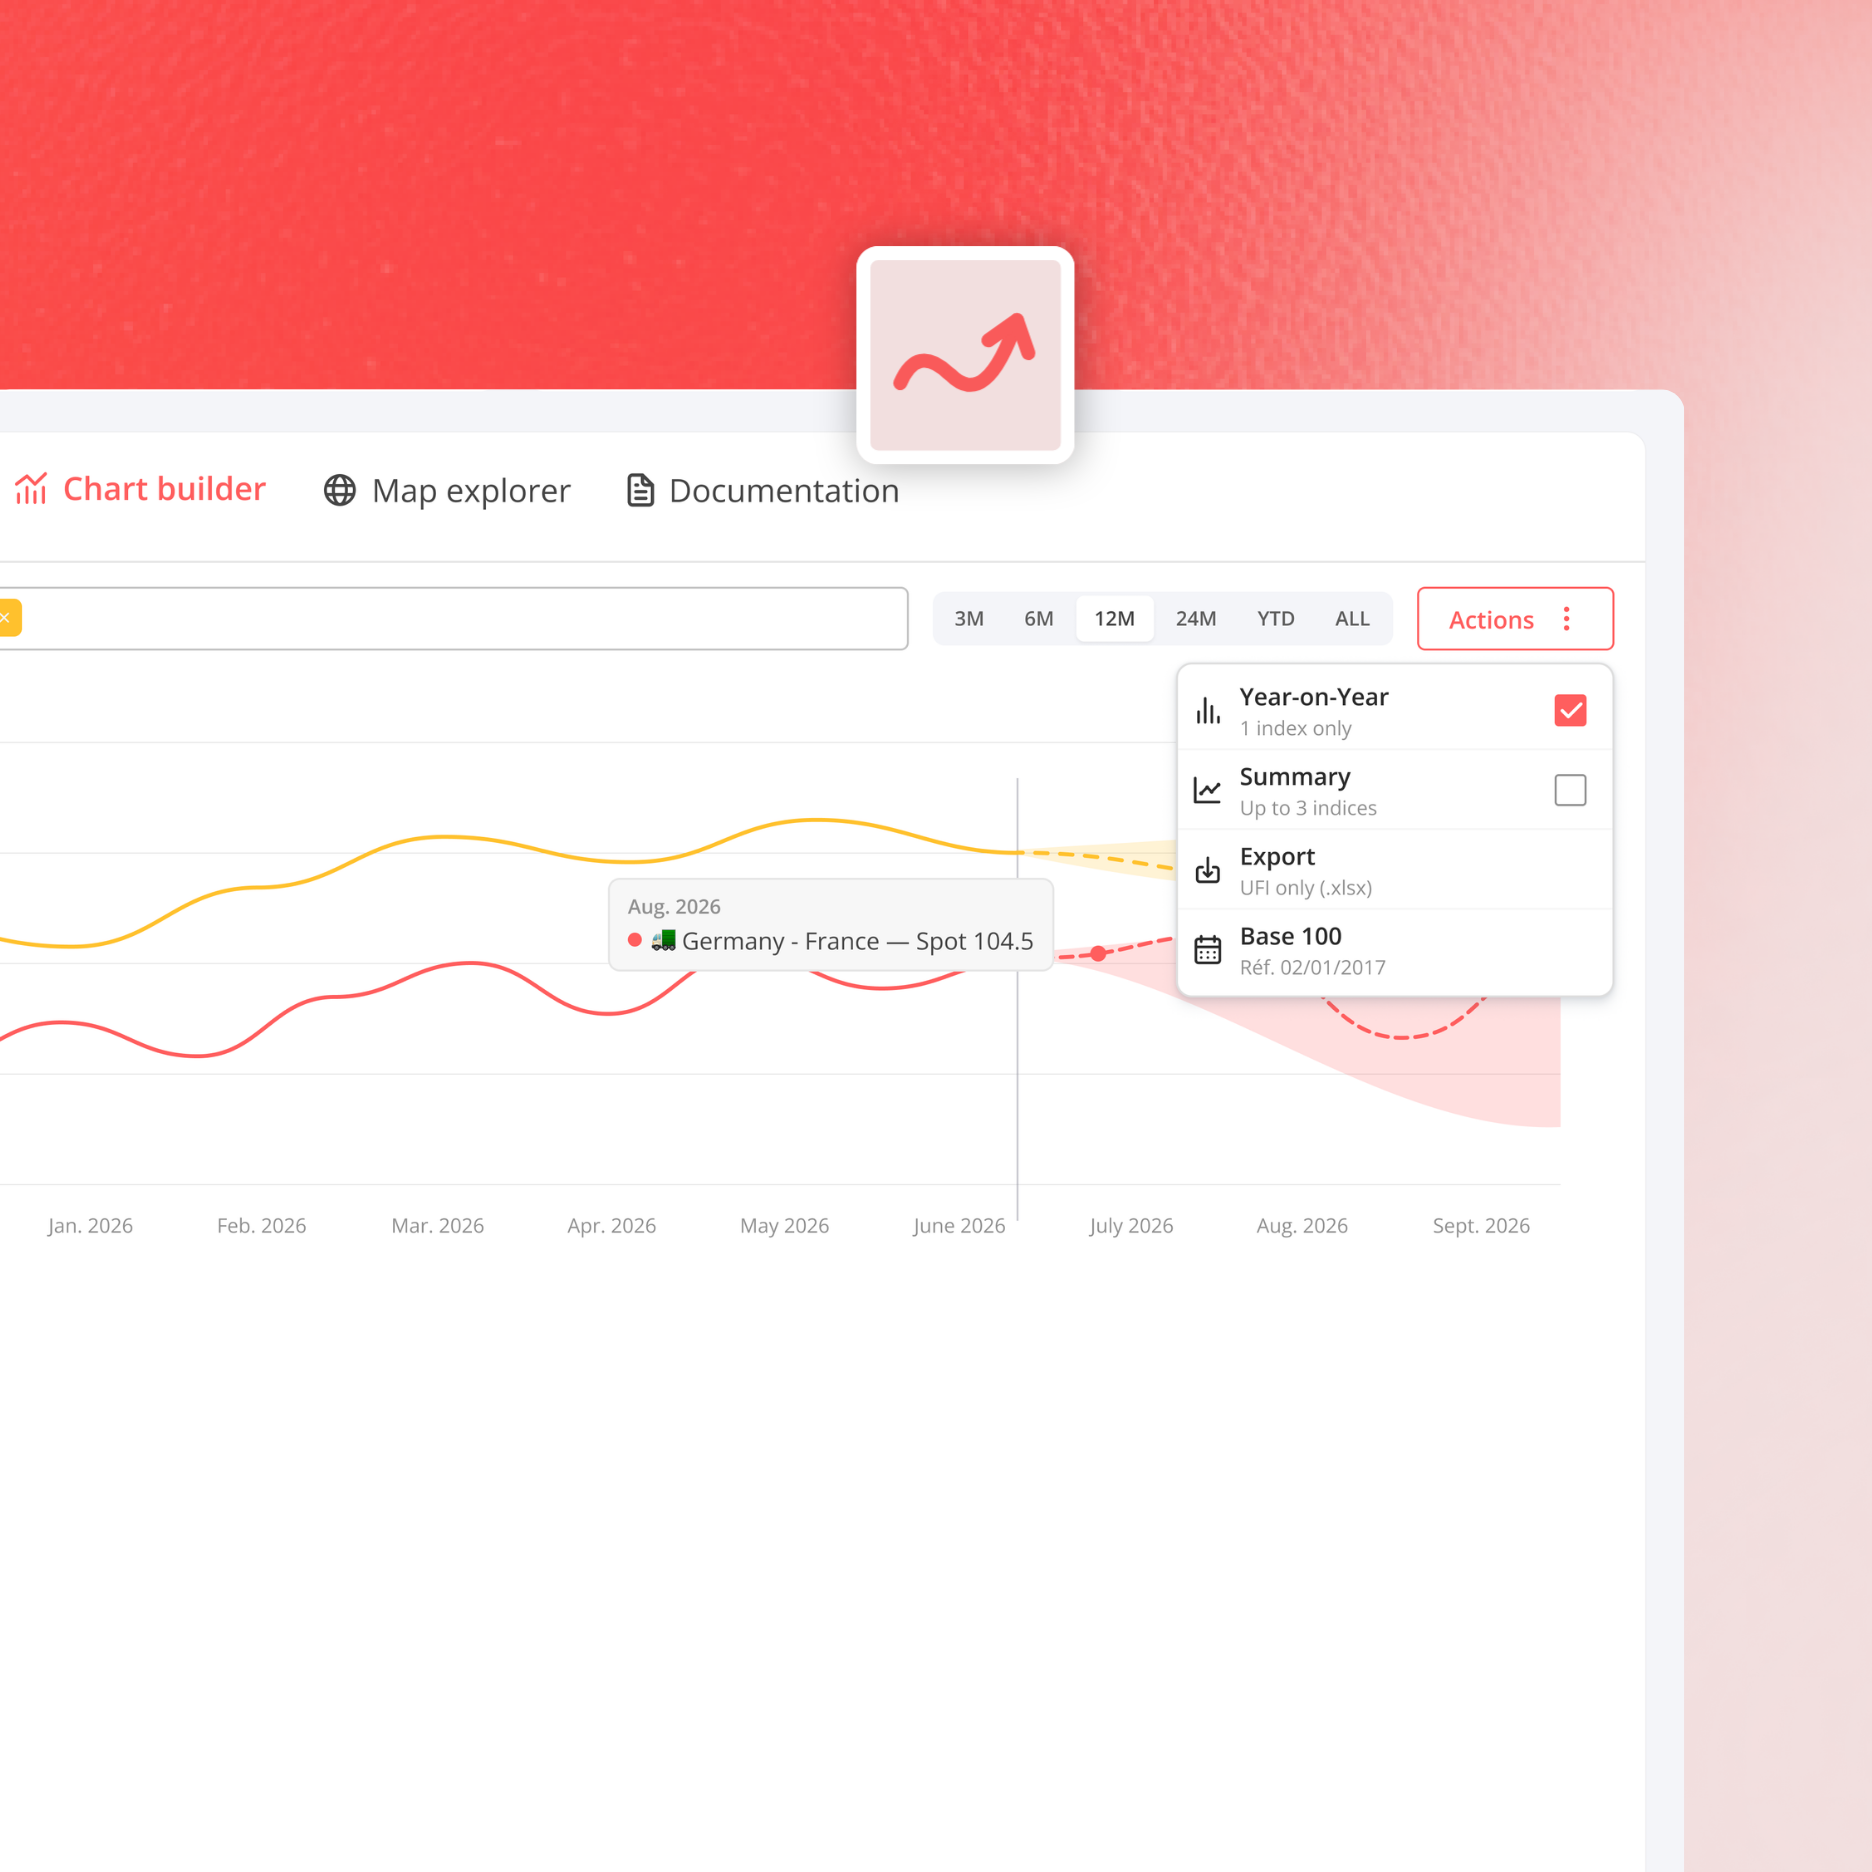
Chart Builder : compare up to six indicators on a single chart to identify correlations and track their evolution over time.
-
Map Explorer : visualize indicators by country and compare European markets at a glance.
upply freight indexes
Upply proprietary indexes
The Upply Freight Indexes are proprietary indexes built from transport data collected and analyzed by Upply. They complement the market indicators available in Data Hub to provide exclusive insights into transport market trends.
-
77 indexes available, including 60 European and 17 global indexes
-
Coverage across road, ocean, air and rail freight
-
Historical data over 3, 6, 12 or 24 months
-
Six-week forecasts to help anticipate market opportunities
-
Compare multiple indexes to better understand market dynamics
→ Ideal for budget planning, rate negotiations and transport tenders.
Our integrated products
A complete platform to manage your transport performance
-
 Benchmark
Compare your prices line by line with the market
-
 Atlas
AtlasAsk your questions and get immediately actionable answers, powered by a specialized AI trained on qualified transport data
-
 Dashboard
Centralize your internal data, track your transport KPIs and compare them with the market
-
 Green
GreenMeasure and manage your CO2 emissions
-
 Freight Management
Access new transport opportunities
-
 Market Insights
Accédez à des baromètres et analyses d’experts pour comprendre et anticiper les évolutions du marché
Ready to make better decisions with market data?
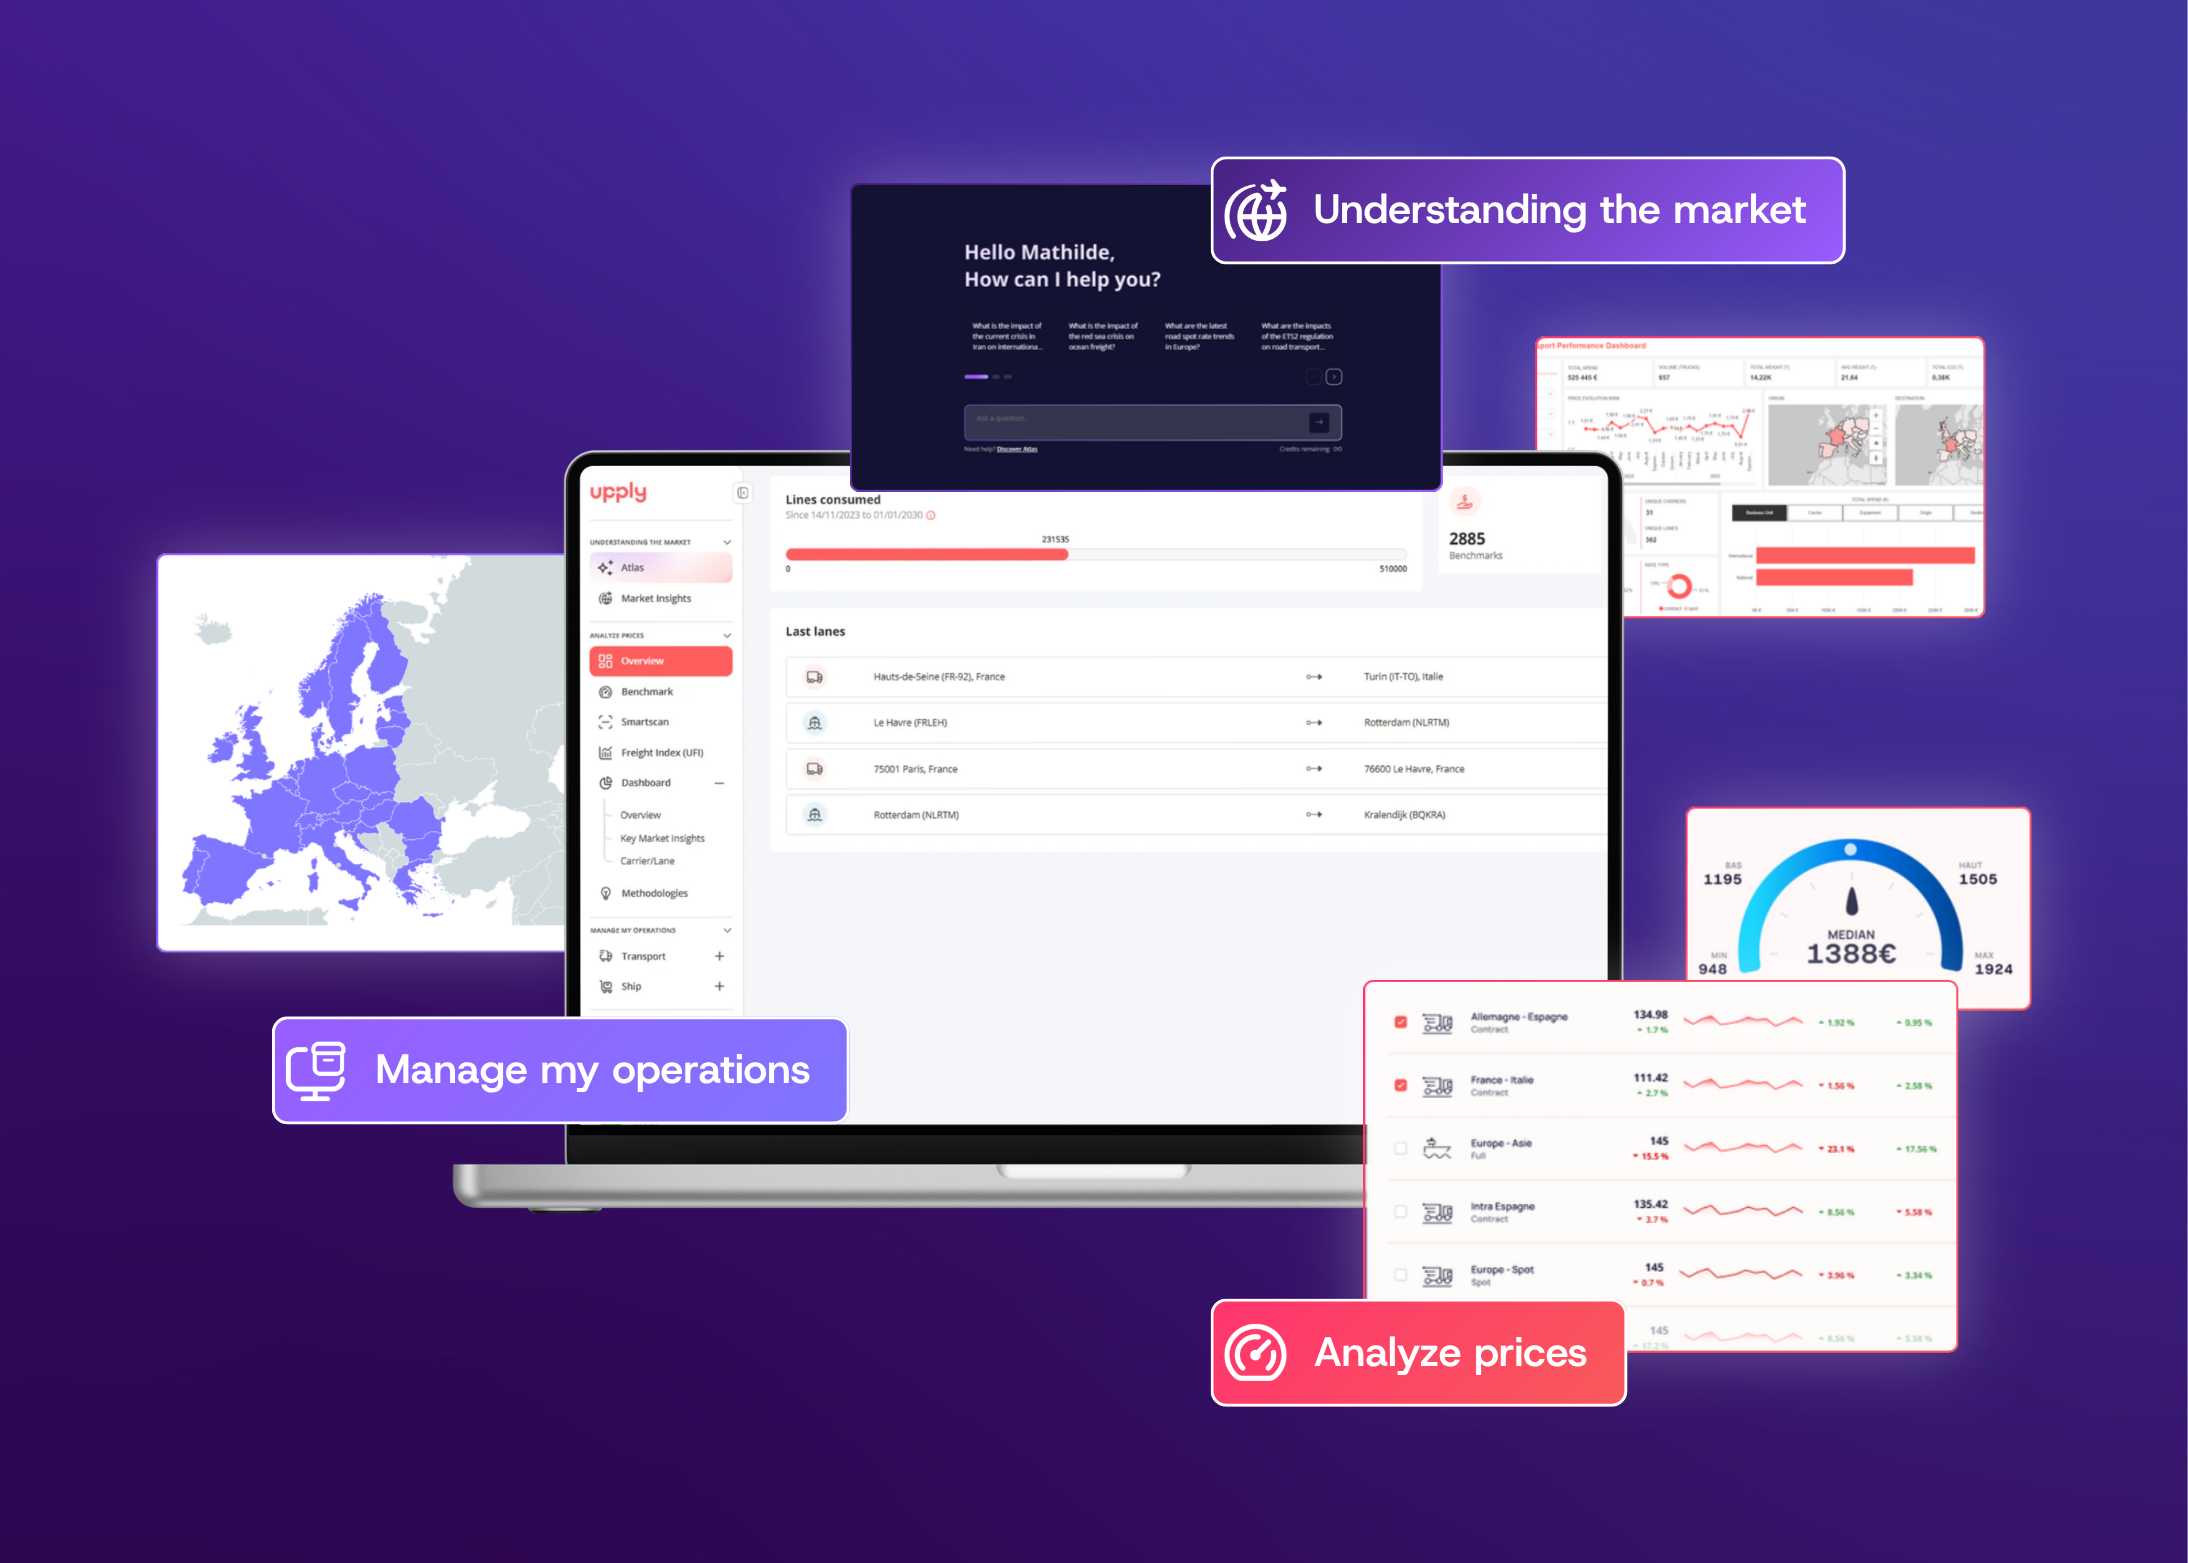
Discover how Data Hub helps you monitor and understand transport market trends:
-
Track the indexes that drive your transport costs in one interface
-
Anticipate negotiations with fuel, toll and freight market trends
-
Analyze market developments with interactive visualization tools